Bounce and Break: Wall Effects and Serve Fluctuations in Racket Sports Live Markets
Written by Otto Wagner · Jul 23, 2026
Bounce and Break: Wall Effects and Serve Fluctuations in Racket Sports Live Markets
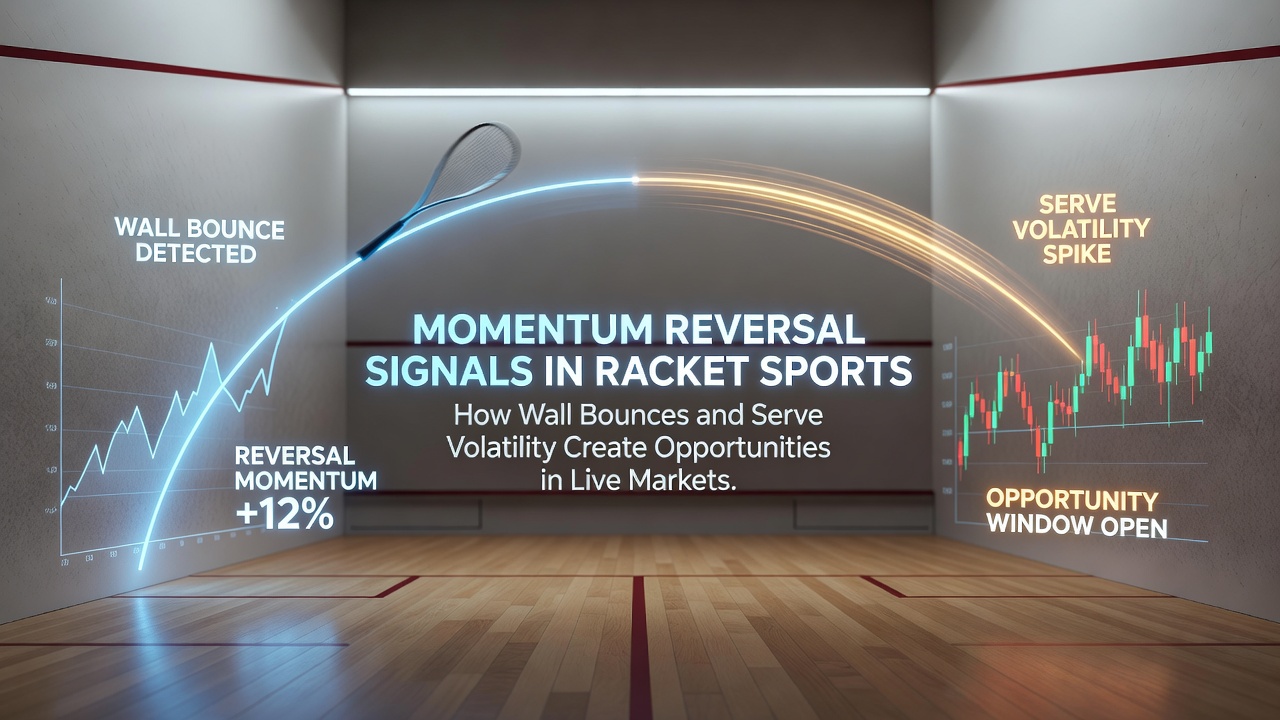
Racket sports present distinct patterns where wall interactions and delivery inconsistencies alter point sequences, and these elements feed directly into live betting adjustments across platforms that track momentum shifts. Observers note that in disciplines like squash and padel the rebound angle off the side or back wall often dictates whether a rally extends or collapses, creating measurable windows for market recalibration during ongoing play.
Wall Interaction Patterns in Enclosed Courts
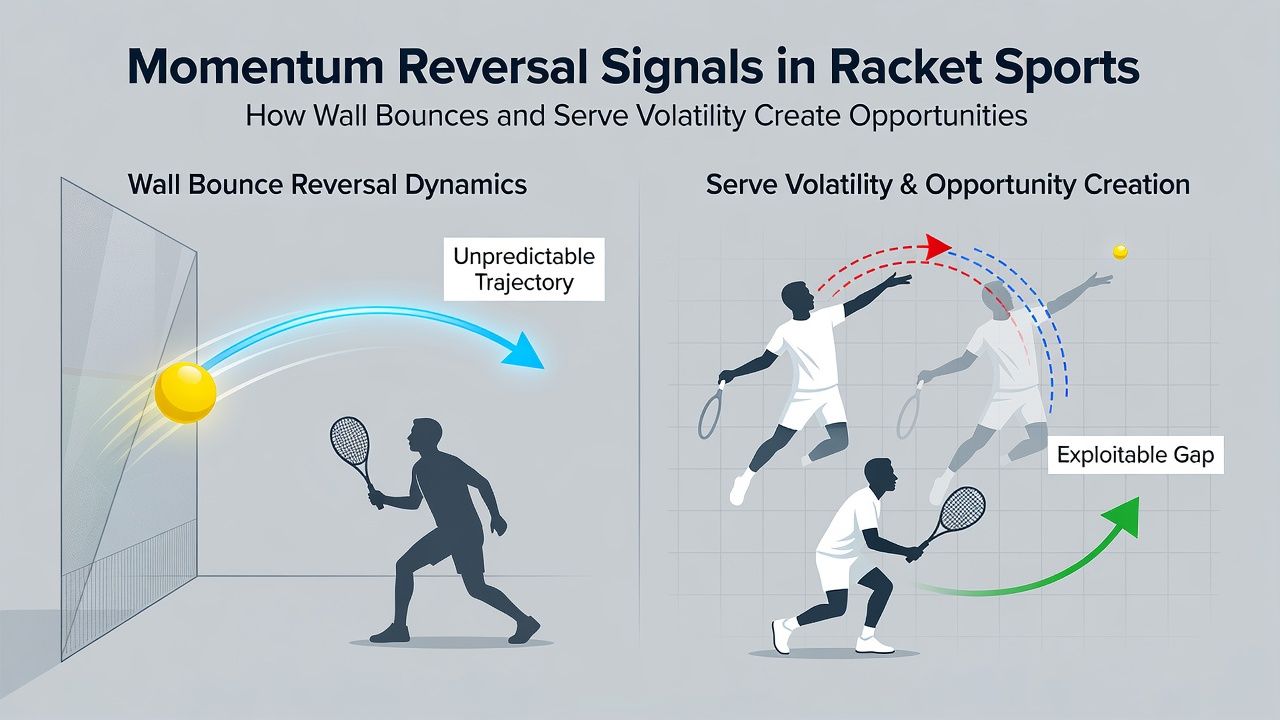
Squash courts confine play within four walls, and the ball's trajectory after contact with these surfaces follows predictable physics that players exploit for positioning, yet small deviations in spin or pace frequently reverse control mid-rally. Data from professional tournaments shows that points ending within three shots after a wall graze occur at rates exceeding 40 percent in elite matches, allowing live odds to reflect sudden probability swings when one competitor forces repeated contacts against the same panel. Padel courts incorporate mesh and glass sections that produce higher, more variable rebounds, and research indicates these surfaces generate approximately 25 percent more unforced errors when players attempt aggressive drives toward the corners during extended exchanges.
Analysts tracking match footage identify clusters where successive wall hits shift the server-receiver dynamic, because the receiving player must adjust footwork within tighter time margins. Those adjustments appear in statistics as increased shot errors on the fourth or fifth stroke of a rally, which in turn influences in-play market pricing for next-point outcomes. A study conducted by the University of Queensland's sports performance laboratory documented these sequences across multiple seasons and confirmed that wall-driven turnovers correlate with measurable drops in the favorite's implied probability on certain exchanges.
Serve Delivery Variations and Point Initiation
Serve volatility arises from differences in spin rate, placement depth, and speed consistency, each of which alters the immediate response window for the receiver. In tennis and padel the first serve success percentage fluctuates between 55 and 65 percent across surfaces, yet second-serve points display wider variance when the server alters toss height or grip pressure under fatigue. Live markets register these changes rapidly because algorithms incorporate real-time ball-tracking feeds that flag deviations from a player's established serve profile.
Figures compiled by the U.S. Tennis Association analytics division reveal that serve fault clusters of three or more within a single service game occur in roughly one of every seven games at ATP level, and such clusters coincide with elevated hold percentages for the opposing player in subsequent service games. Observers tracking these sequences note that volatility spikes appear most frequently on clay and artificial grass, where surface friction modifies bounce height and forces servers to recalibrate mid-match.
Integration into Live Market Frameworks
Betting platforms that stream ball-tracking data integrate wall contact logs and serve metrics into their pricing engines, allowing odds to adjust within seconds of each point conclusion. When a player records consecutive wall-induced errors, the market for the next point or game often widens the underdog's implied probability by several percentage points before the subsequent rally begins. Similarly, serve fault runs trigger temporary adjustments in over-under total points markets because extended rallies become statistically more likely once consistency erodes.
Industry reports from the Canadian Gaming Association highlight that racket sport volumes in live channels have grown steadily through mid-2026, with July 2026 figures showing a 12 percent increase in in-play turnover compared with the same period in the prior year. This growth aligns with expanded use of optical tracking systems that capture wall angles and serve metrics at higher resolution, enabling more granular market segmentation during individual points.
Sequence Recognition Across Match Phases
Early sets display different reversal frequencies than deciding sets because fatigue accumulates and alters both rebound judgment and serve mechanics. Data sets from professional padel circuits indicate that wall error rates rise by approximately 8 percent after the 90-minute mark, while serve double-fault percentages increase in the final two games of a set when players have contested more than ten previous service holds. Live traders monitor these cumulative effects through aggregated player profiles rather than isolated shots.
Examples from recent international events demonstrate that a single sequence of three wall rebounds followed by a serve fault can shift game odds by more than 15 percent within a 30-second window. Market participants who follow the underlying metrics therefore position entries after these micro-events rather than after completed games, because the probability adjustment occurs faster than traditional score-based updates.
Conclusion
Wall bounce characteristics and serve delivery fluctuations supply quantifiable signals that reshape point probabilities in real time across racket sport competitions. Platforms incorporating optical data streams translate these physical variables into live market movements, and participants who monitor the same inputs gain access to timing advantages during match segments where reversal frequency rises. Continued refinement of tracking technology through 2026 supports further segmentation of these signals within existing betting frameworks.