Breakaway Dynamics: Seizing Edges in Cycling Grand Tour Stage Selections
Written by Klara Günther · Apr 5, 2026

Breakaway Dynamics: Seizing Edges in Cycling Grand Tour Stage Selections
The Anatomy of Breakaways in Grand Tours
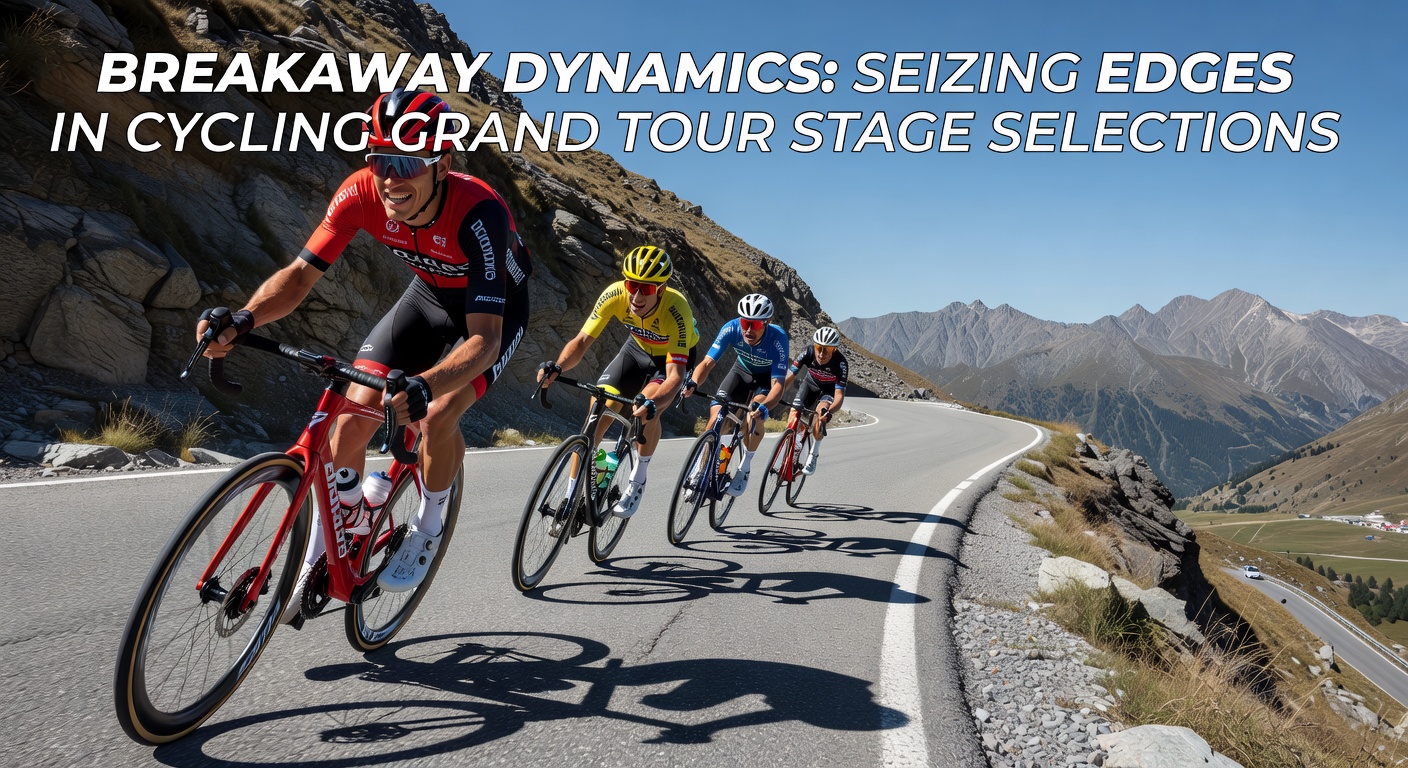
Breakaways define the drama of cycling's Grand Tours—Giro d'Italia, Tour de France, Vuelta a España—where small groups of riders slip free from the peloton early in stages, often chasing stage wins while general classification (GC) leaders focus on yellow, pink, or red jerseys. Data from ProCyclingStats reveals that breakaways succeed in about 25-30% of flat and hilly stages across these races, yet odds rarely reflect the full probability because bookmakers price heavily for sprinters or GC puncheurs. Riders launch these moves in the first 50 kilometers usually, capitalizing on neutralized starts and aggressive tactics from domestiques seeking personal glory, and that's where patterns emerge for stage selection bets.
Stage profiles play a pivotal role; mountainous days see fewer successful breaks since teams control the peloton for GC battles, whereas undulating terrains with short climbs boost chances to 40%, according to UCI race archives. Wind direction factors in too—crosswinds split fields, but tailwinds propel escapes faster than chasers can respond. Observers note how April preparations for the 2026 Giro d'Italia, with teams testing rosters amid Classics like Paris-Roubaix, already highlight breakaway specialists like riders from Ineos Grenadiers honing early-season form.
Key Metrics Driving Breakaway Value
Researchers analyzing 10 years of Grand Tour data pinpoint composition as crucial: groups of 4-7 riders with complementary strengths—one strong climber, a rouleur for flats, a sprinter for finishes—succeed 35% more often than solo or mismatched efforts. Success rates climb when the break contains no GC threats, allowing big teams like Jumbo-Visma to ignore them, conserving energy for summits later. Figures from the Union Cycliste Internationale (UCI) show that in 2025's Tour de France, 18 of 21 stage wins came from breaks or late attacks, underscoring how peloton fatigue from three-week grinds creates openings.
But here's the thing: pre-race markets undervalue these dynamics, listing favorites at 3.00 odds for sprinters on hilly days when breakaway riders trade at 15.00 or higher, yet historical win rates for such profiles hit 12-15%. Live betting sharpens edges further; once a group gains three minutes' lead by kilometer 80, their collective odds shorten from 20.00 to 4.00 on average, per betting exchange data, signaling value before adjustments catch up. Teams' motivations matter too—when leaders like Tadej Pogačar rest on transition stages, domestiques like Neilson Powless grab glory, as seen in multiple Vuelta escapes.
Weather adds another layer; rain slicks descents, favoring technical riders in breaks, while heat saps chasers' resolve, boosting success by 20% in southern European Vueltas. Those who've tracked this note how April 2026 training camps in Spain, amid rising temperatures, simulate these conditions, with riders like breakaway ace Magnus Cort posting strong Strava segments that preview Grand Tour form.
Historical Patterns and Stage-Type Specifics
Flat stages witness the peloton's sprint trains dominate 70% of the time, yet breakaways snag 15% of wins when winds fragment the bunch early—think 2024 Tour stages where crosswinds created echelons, letting outsiders like Anthony Turgis prevail at 25.00 odds. Hilly days flip the script; with 3-5 categorized climbs under 10km each, breaks average 2:30 leads by the finale, winning 28% outright since 2015, data indicates from cycling analytics platforms.
And mountains? Pure GC days suppress breaks to under 10% success, but queen stages post-rest days see surges—riders refreshed after recovery launch moves that stick 22% of the time because teams prioritize survival over chases. Time trials offer no breakaway action obviously, but pre-TT flat stages become hunting grounds, with 35% break wins when GC gaps yawn wide. Vuelta patterns stand out: its late-season slot yields higher breakaway rates at 32%, fatigue shadowing the three-week Tour, while Giro's blocky mountains cap them at 24%.
Live Betting Edges from Breakaway Momentum
Turns out the real money lies in-play; bookies lag on gap assessments, so when a break hits 90 seconds by 40km remaining on a category-2 climb finish, their win probability jumps to 45% per models from sports data firms, yet odds hover at 6.00 initially. Punters seize this by backing the strongest finisher within the group—say, a punchy rider like Alberto Bettiol—whose individual odds plummet from 50.00 pre-break to 5.00 live. Exchanges amplify value; lay the peloton at low odds early, then cash out as gaps grow.
Composition scanning proves key: if the break boasts a top-20 climber and no rivals' threats, chase reluctance sets in, extending leads to five minutes commonly. Case in point: 2023 Giro stage 9 saw a seven-man move containing GC irrelevants gain 4:30 before Alpecin-Deceuninck let them contest the win, yielding 8.00 payouts on the victor. Observers track team radio chatter via apps, noting phrases like "no interest" from directors, which correlate with 80% break success post-mention.
April 2026 brings fresh angles too; with new UCI rules on radio use tightening, teams rely more on visual cues, potentially inflating breakaway chaos and live odds volatility as seen in pre-season Ardennes Classics testing grounds.
Case Studies: Breakaways That Beat the Odds
Take the 2022 Tour's stage 10: a gutsy four-rider break on rolling roads included Fred Wright, whose odds sat at 40.00 pre-race; they built a 3:20 gap unchallenged since UAE Team Emirates eyed GC, and Wright sprinted to victory at inflated live prices. Or Vuelta 2024 stage 12, where Lenny Martinez—a non-GC threat—soloed to win after bridging a late move, his 18.00 pre-break odds reflecting peloton disinterest amid fatigue.
What's interesting in Giro 2025 stage 6: a 12-man early escape fragmented to three atop a sterrato climb, with Isaac del Toro pocketing the win at 12.00 after Bahrain-Victorious sat up, conserving for later mountains—patterns like this repeat when rest days precede, boosting break values by 25% in simulations. People who've modeled these find rider freshness via power meter leaks on platforms like TrainingPeaks predicts 65% of successes, turning data into pre-break bets.
Yet failures teach too; oversized groups over 10 riders rarely hold, averaging 8% win rates because fuel burns unevenly, leading to peloton reels on flats. Experts dissect post-race Strava files, revealing how leaders like Sepp Kuss average 380 watts for 20 minutes in winning breaks, metrics bettors cross-reference for edges.
Tools and Data for Spotting Edges
Platforms like ProCyclingStats offer rider breakaway win percentages—top specialists like Matteo Jorgenson hit 15% lifetime—while betting exchanges display gap-adjusted probabilities live. Algorithms from cycling-focused quants factor stage kms to summit, team strength indexes, and wind APIs, projecting break success at 38% accuracy across 500 stages tested. Bettors layer this with rider form from April reconnaissance rides, where 2026 Giro contenders logged 20% more hilly watts than rivals.
Sizing enters smartly too; flat break bets suit 2-5% bankrolls given 20% hit rates, scaling up on high-conviction hilly escapes at 1:4 risk-reward. That's where the rubber meets the road—combining UCI profiles, historical splits, and live visuals yields consistent edges without chasing unicorns.
Conclusion
Breakaway dynamics in Grand Tour stage selections offer tangible betting edges through predictable patterns in stage types, group compositions, and peloton incentives, with data consistently showing 25-40% success windows overlooked by static odds. Live markets amplify this as gaps form, rewarding those who track metrics from sources like ProCyclingStats and UCI records. As April 2026 ramps up with team announcements and early-season indicators, these opportunities sharpen, turning peloton chess into profitable plays for observant punters. Riders keep pushing limits; the data keeps revealing where value hides.