Cycling Grand Tours Reveal Fatigue Patterns Through Physiological Tracking
Written by Otto Wagner · Oct 16, 2026
Cycling Grand Tours Reveal Fatigue Patterns Through Physiological Tracking
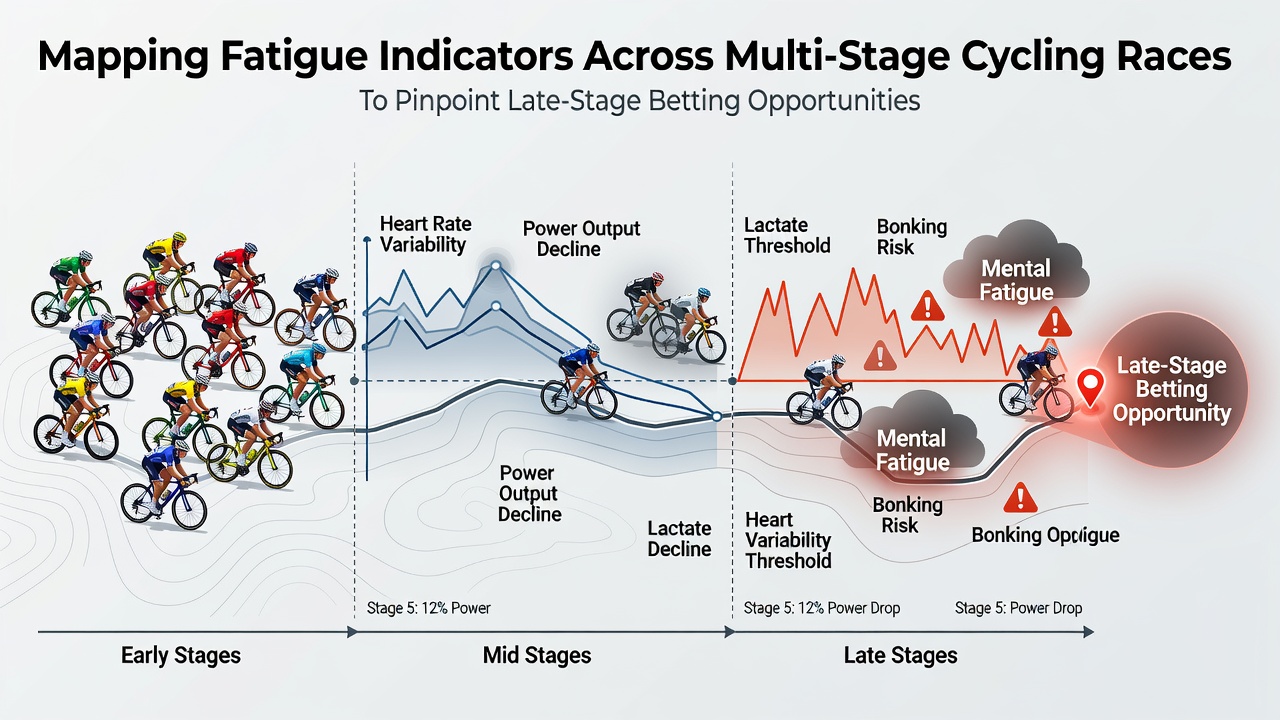
Multi-stage cycling races such as the Tour de France and Giro d'Italia span three weeks with daily efforts that accumulate physical demands on riders, and observers note how power output metrics combined with heart rate recovery times create measurable fatigue curves across successive stages. Teams collect data on normalized power, functional threshold power ratios, and variability indexes that decline as cumulative elevation gain exceeds 30,000 meters in later weeks, while researchers track these shifts through onboard sensors that record every pedal stroke and cardiac response during both flat transitions and high-mountain finishes.
Core Indicators Used in Fatigue Mapping
Analysts compile stage-by-stage profiles that include average watts per kilogram sustained over climbs, heart rate drift during prolonged efforts above threshold, and overnight recovery scores derived from sleep and resting heart rate data, and these variables together form layered maps that highlight when individual riders begin to lose peak output. Studies from sports physiology laboratories show that after the second week riders often experience a 5 to 12 percent drop in sustainable power on repeated steep gradients, with the effect most pronounced among those who have contested multiple breakaways or led aggressive pace lines earlier in the race.
Data Collection Across Race Calendars
Professional squads integrate GPS files, power meter readings, and blood lactate samples taken at stage ends to build longitudinal datasets, whereas independent analysts cross-reference public Strava segments and race timing splits to approximate the same trends without team-level access. According to reports published by the Australian Institute of Sport, repeated high-intensity efforts separated by short recovery windows accelerate glycogen depletion patterns that manifest as reduced cadence sustainability after day 14, and similar patterns appear in data aggregated from multiple editions of the Vuelta a España.
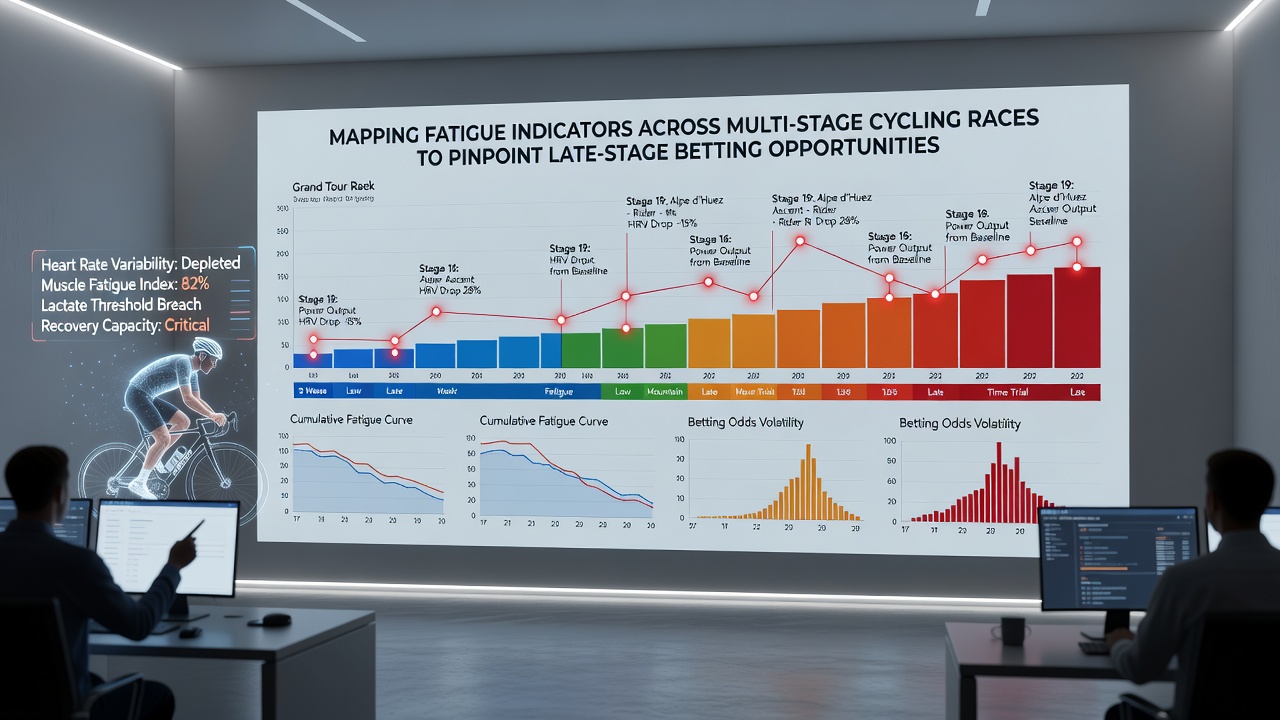
Mapping tools plot these indicators against route profiles so that predicted performance decay can be compared against bookmakers' closing odds for stage wins, overall classifications, and top-three placings on final mountain days. When early-week data shows a rider maintaining high variability indexes while rivals already exhibit drift, later stages frequently present discrepancies between perceived form and actual remaining capacity.
Application to Late-Stage Betting Markets
Betting exchanges and sportsbooks adjust lines for individual stage outcomes and general classification positions as fatigue signatures become visible through mid-race results, and those monitoring the mapped indicators often identify value when favorites who started strongly begin posting slower sector times on repeated summit finishes. One analysis of three consecutive Grand Tours found that riders whose normalized power fell below 85 percent of their opening-week average placed outside expected top-10 finishes at rates exceeding 60 percent in the final seven days, creating measurable edges in live and ante-post markets focused on late stages.
European research groups have published datasets that correlate cumulative vertical meters with changes in peak heart rate during final climbs, and these correlations help isolate riders whose early aggression produces outsized fatigue that surfaces only after rest days fail to restore full capacity. Observers cross-check such findings against weather-adjusted performance logs because heat stress and altitude combine with distance to amplify the recorded drops in output.
Case Patterns From Recent Seasons
During the 2025 season several contenders who posted strong opening mountain stages showed measurable increases in heart rate drift by stage 16, and their subsequent results aligned with the mapped fatigue thresholds rather than with pre-race expectations. Data aggregated from timing companies reveals that teams adjusting tactics based on these indicators shifted resources toward domestiques who preserved higher recovery scores, altering the composition of breakaways in the final week and thereby influencing available betting lines on stage winners and mountain classification points.
Industry reports from cycling federations outside the UK, including those issued by USA Cycling performance units, document similar physiological trends in multi-day events held in North America, confirming that the same indicator clusters appear across different race calendars and rider cohorts. These consistent patterns allow systematic comparison of early versus late performance without reliance on subjective commentary.
Conclusion
Physiological tracking across multi-stage cycling events produces quantifiable fatigue maps that align with shifts in late-race outcomes, and the resulting datasets support objective analysis of performance decay through established metrics such as power ratios and recovery scores. As sensor technology and public data access continue to expand, the precision of these maps increases, offering structured inputs for markets that focus on stages after cumulative demands have altered rider capacities.