Mapping Microclimate Variations at Outdoor Venues and Their Impact on Event Outcome Probabilities
Written by Riley Hughes · Aug 22, 2026
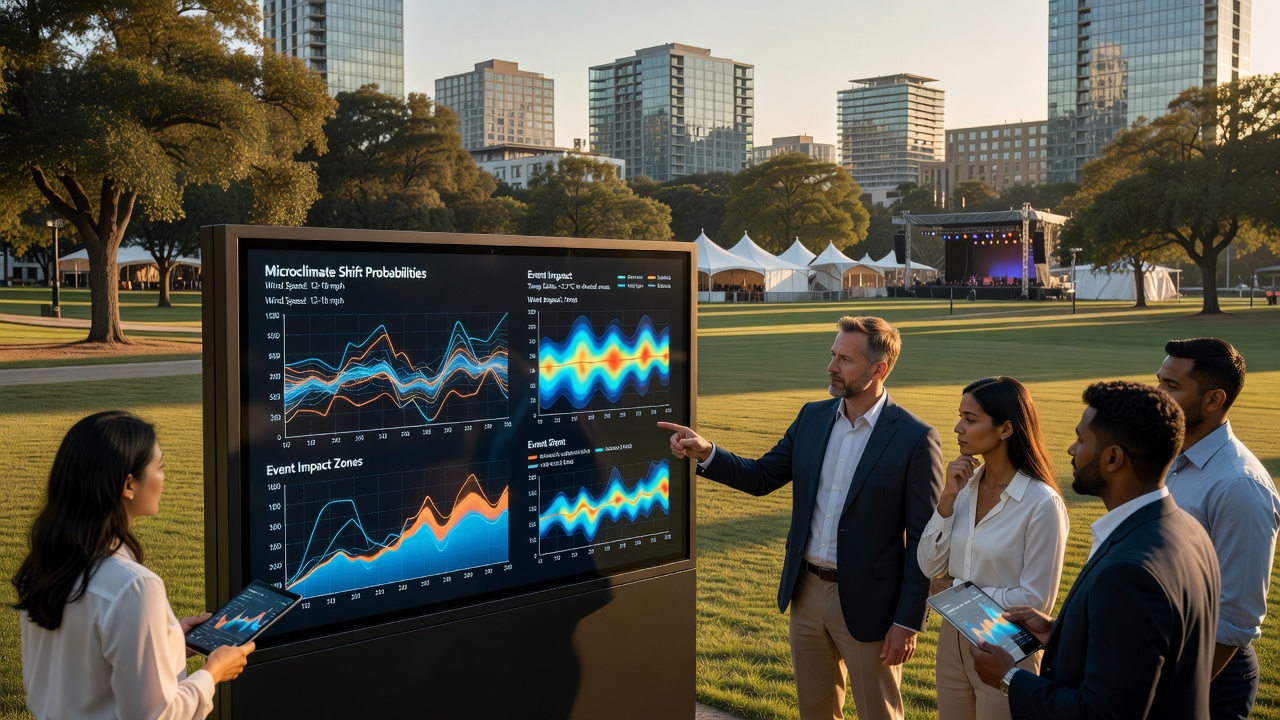
Mapping Microclimate Variations at Outdoor Venues and Their Impact on Event Outcome Probabilities
Event organizers and meteorologists have tracked how localized climate conditions at competition sites alter performance metrics in multi-discipline outdoor activities such as triathlons and adventure races, and data collected over multiple seasons shows these microclimates create measurable shifts in result distributions. Temperature gradients as small as two degrees Celsius across a single course section can change swimmer exit times by several seconds while wind patterns in transition zones affect cyclist speeds and runner pacing simultaneously.
Understanding Microclimate Formation at Event Sites
Researchers from institutions including the Australian Bureau of Meteorology have documented that natural terrain features combined with temporary structures generate distinct microclimates during large gatherings, and these conditions deviate from regional forecasts because water bodies, elevation changes, and urban barriers trap or redirect airflow. In one documented case from a coastal triathlon venue, humidity levels near the swim exit remained 15 percent higher than areas 400 meters inland due to evaporation from adjacent marshes, which altered dehydration rates among competitors who exited the water first.
Studies indicate that August 2026 events scheduled across varied North American and European locations will require updated modeling because construction of spectator areas and equipment zones further fragments airflow patterns, and historical records from similar gatherings reveal probability curves for finish times widen when microclimate data gets incorporated into pre-event simulations.
Data Collection Methods and Distribution Shifts
Teams deploy arrays of portable sensors to record wind speed, solar radiation, and surface temperature at 50-meter intervals along each discipline segment, and the resulting datasets feed into statistical models that recalculate expected outcome ranges. Evidence from Canadian weather service archives demonstrates that a 3-meter-per-second crosswind localized to one side of a cycling loop increased split time variance by 22 percent compared to uniform conditions recorded the previous year.
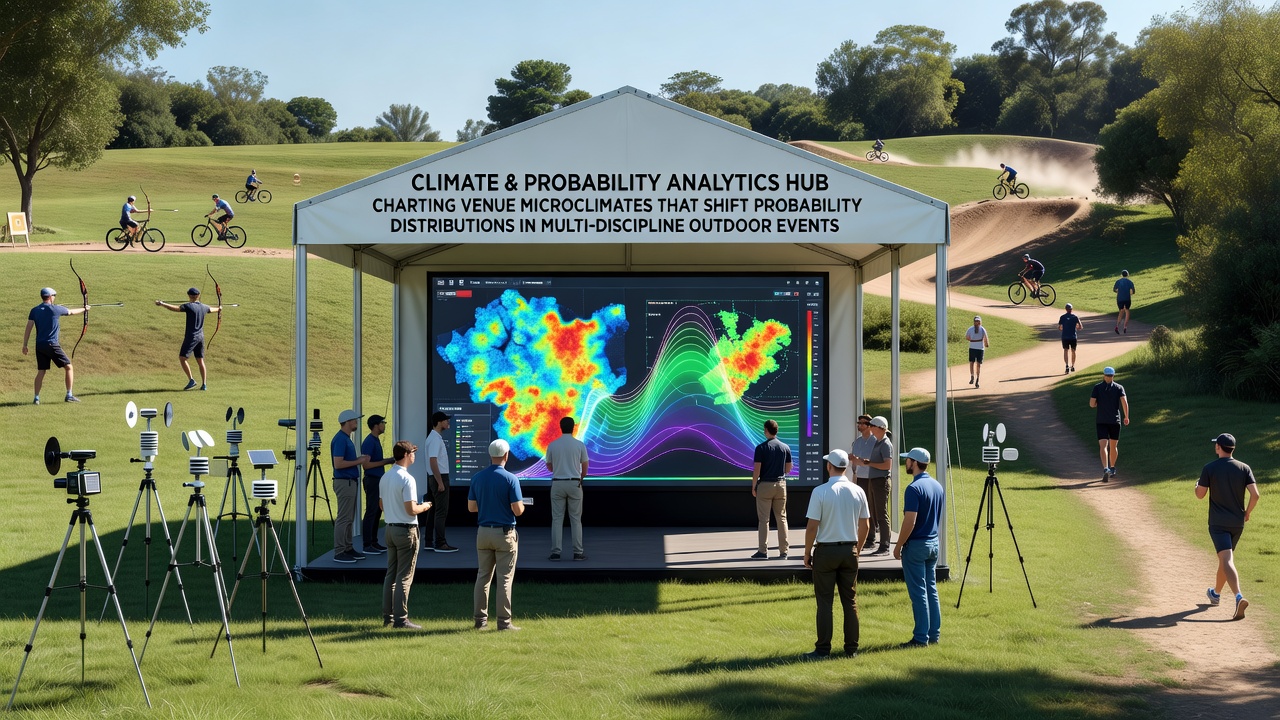
Analysts at the European Centre for Medium-Range Weather Forecasts have refined algorithms that integrate these on-site readings with satellite imagery, and the updated projections show tighter clustering of top-finisher times when microclimate adjustments get applied versus broad regional averages. Observers note that transition areas often exhibit the sharpest gradients because concrete surfaces and tent placements create heat islands that raise ambient temperatures by up to four degrees during peak sunlight hours.
Applications in Event Planning and Athlete Preparation
Logistics coordinators now request microclimate reports months ahead of multi-discipline competitions to adjust start times and course layouts, and organizations such as the International Triathlon Union have incorporated these variables into safety protocols after reviewing incident data tied to sudden wind shifts near water entries. One study published through university research channels in New Zealand revealed that runners facing a localized temperature drop of three degrees across a 5-kilometer segment recorded average heart rates 8 beats per minute higher than those on the same course under stable conditions.
Coaches use probability distribution updates derived from venue charting to tailor pacing strategies for individual athletes, and the approach has produced measurable changes in qualification rates at regional championships where microclimate-informed training plans were implemented. Government environmental agencies in multiple regions continue to expand sensor networks at popular event locations because consistent data streams support both performance analysis and public safety assessments.
Conclusion
Continued refinement of microclimate charting techniques supplies event stakeholders with granular inputs that refine statistical models of participant outcomes across swimming, cycling, and running segments, and the integration of real-time sensor feeds with established forecasting systems has already demonstrated capacity to narrow uncertainty ranges in projected result distributions. As additional venues adopt standardized monitoring practices ahead of 2026 gatherings, the accumulated records will further clarify how site-specific atmospheric variations interact with athlete physiology and equipment choices to shape overall competition profiles.