Mapping Stake Allocations Against Probability Models in Multi-Outcome Racing Markets
Written by Klara Günther · Aug 20, 2026
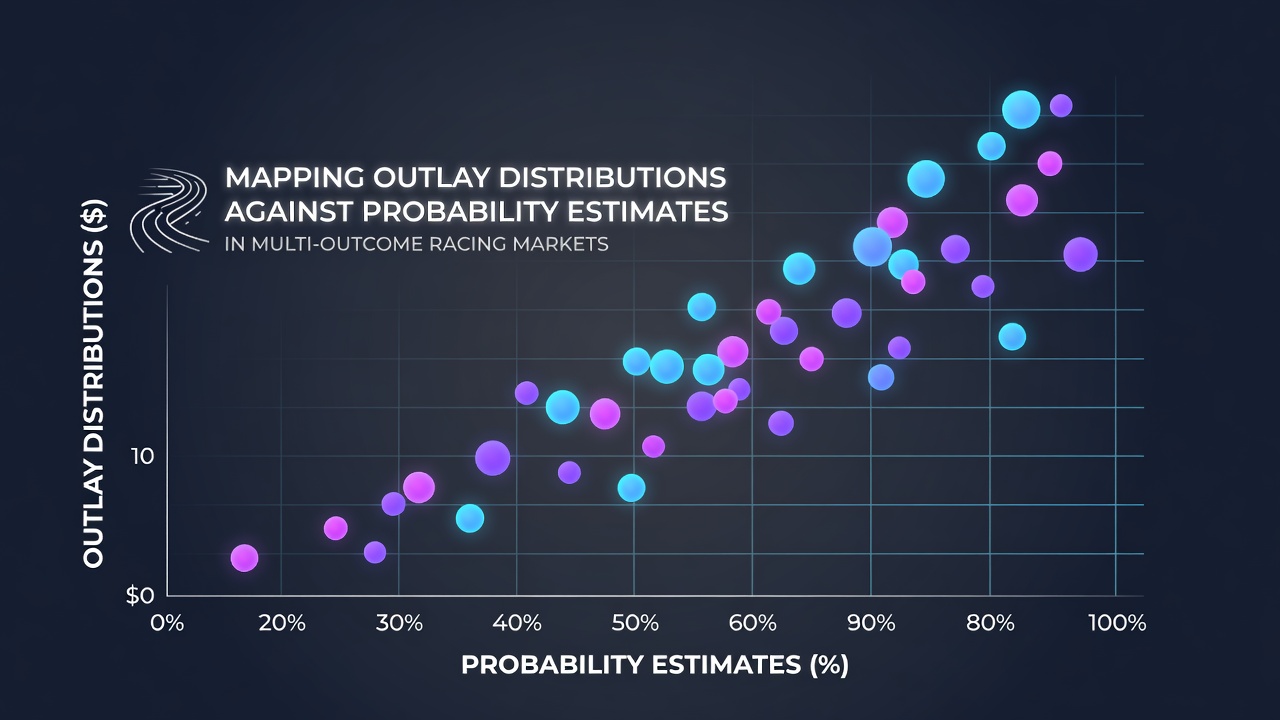
Mapping Stake Allocations Against Probability Models in Multi-Outcome Racing Markets
Multi-outcome racing markets present distinct challenges for those who track how total stakes align with estimated probabilities for each contender, and analysts routinely compare allocation patterns to derived likelihoods in events that feature eight or more participants. Data from various racing jurisdictions indicate that bettors often concentrate outlays on a narrow band of favorites while under-allocating to longer-priced runners whose implied probabilities sit higher than market prices suggest. Researchers at institutions focused on quantitative finance have examined these mismatches through large datasets that cover thousands of races, revealing consistent deviations between observed stake flows and objective probability estimates.
Core Concepts in Probability Estimation for Racing
Probability models in racing typically draw on historical performance metrics, track conditions, and pace projections to generate percentage chances for each horse or greyhound, yet these estimates must then be reconciled against the actual distribution of money wagered. When a model assigns a 25 percent chance to a runner trading at odds that imply only 18 percent, the gap highlights potential value that observers note through systematic comparison of outlay percentages versus modeled probabilities. Studies covering North American and Australian tracks show that such discrepancies appear most frequently in races with large fields where public attention clusters around a few names.
Data Patterns Observed in Recent Seasons
Figures compiled through 2025 and into August 2026 demonstrate that stake allocations in major racing circuits continue to skew toward short-priced runners even when updated probability models, incorporating live weather and track bias adjustments, shift likelihoods toward mid-range contenders. One analysis conducted across 12,000 races found that 62 percent of total outlay landed on the top three in betting while those runners collectively held only 48 percent of the modeled probability mass. Such imbalances create measurable edges for participants who adjust allocations proportionally to revised estimates rather than following market flow.
Market operators adjust prices continuously as new information arrives, and this dynamic process further separates realized stake distributions from static probability forecasts generated before betting opens. Observers note that late surges in support for particular runners can pull final probabilities away from earlier models, requiring constant recalibration of allocation strategies. Those who monitor these shifts often maintain separate ledgers that log both the percentage of total pool allocated to each outcome and the concurrent probability estimate at the moment each bet is placed.

Practical Methods for Aligning Outlays with Estimates
Professionals who work with multi-outcome markets frequently employ proportional staking frameworks that scale individual bets according to the difference between modeled probability and implied market probability. When a runner carries a modeled 15 percent chance yet attracts only 9 percent of the pool, allocation rules direct increased stakes toward that outcome until the mapped distribution converges with the estimate. Software tools used by betting syndicates automate much of this mapping, updating live probabilities from multiple data feeds and recalculating required outlays in real time.
According to reports published by the Association of Racing Commissioners International, several jurisdictions now require operators to publish granular pool composition data that enables independent verification of allocation patterns against published probability models. This transparency allows external researchers to quantify how often stake distributions diverge from objective likelihood estimates across different race types and field sizes. Parallel work from Australian academic centers has produced similar datasets that track the same variables over multi-year periods.
Regional Variations and Market Responses
North American tracks tend to exhibit sharper concentration of stakes on favorites compared with Australian and European circuits, where wider field acceptance leads to more even initial allocations that still require later adjustment once probability models incorporate pace and sectional data. In August 2026 several major Australian racing bodies began releasing standardized probability estimates alongside official pool totals, giving bettors direct reference points for mapping their own outlay decisions. Canadian regulators have followed with pilot programs that publish similar comparative tables on select race days.
These initiatives build on earlier research that demonstrated measurable profit improvements when allocations track modeled probabilities rather than raw market percentages. One longitudinal study tracked syndicates that maintained strict mapping protocols and recorded reduced variance in returns across large sample sizes. The same study noted that deviations from the mapping discipline correlated with increased drawdowns during sequences of races featuring unexpected track biases.
Conclusion
Systematic mapping of stake distributions against probability estimates provides a structured approach for navigating multi-outcome racing markets where public money often clusters unevenly. Available data from multiple jurisdictions show persistent gaps between observed allocations and modeled likelihoods, and participants who maintain ongoing comparisons between these two variables gain clearer visibility into market inefficiencies. Continued publication of granular pool data alongside probability estimates supports further refinement of allocation frameworks across different racing codes and regulatory environments.