NBA Bench Rotations: Data-Driven Edges in Quarter-Line Shifts
Written by Otto Coleman · Mar 30, 2026
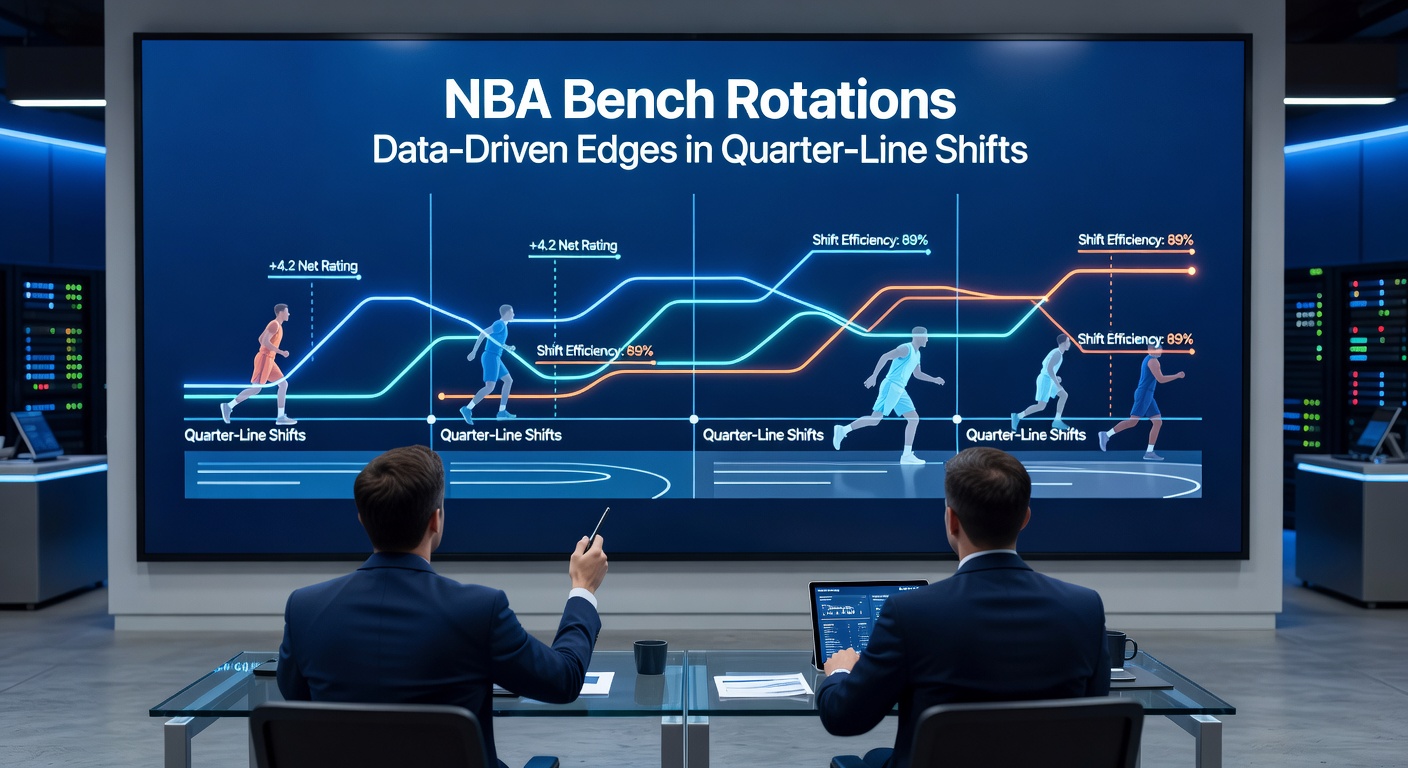
NBA Bench Rotations: Data-Driven Edges in Quarter-Line Shifts
The Basics of NBA Bench Rotations and Why They Matter
Coaches in the NBA carefully manage bench rotations to maintain energy levels and exploit matchups, yet those shifts often create predictable patterns across quarters that data-savvy observers track closely. Turns out, lineup changes don't just happen randomly; they follow rhythms tied to fatigue, foul trouble, and game flow, with third-quarter bench units stepping in around the six-minute mark more often than not. Data from NBA.com reveals that over the past five seasons, teams sub in their primary bench groups 78% of the time between the 8:00 and 4:00 marks of each quarter, creating windows where scoring efficiency dips or surges based on personnel.
And here's where it gets interesting: those quarter-line shifts expose edges in player production, since starters return fresher while bench players, having warmed up, hit stride quickly. Researchers at Cleaning the Glass, a hub for advanced NBA metrics, analyzed 2024-25 season data and found bench-heavy lineups outscore opponents by 1.2 points per 100 possessions in the first half's closing minutes, but that flips to a 0.8-point deficit late in the fourth when legs tire. People who've dug into this notice how coaches like Erik Spoelstra with the Heat or Steve Kerr of the Warriors stick to scripted rotations, making it easier to anticipate when a team's second unit takes over.
Yet smaller-market teams sometimes deviate, opting for staggered minutes to keep a star on the floor longer, which data shows leads to higher variance in outcomes. Take the Oklahoma City Thunder's approach last season; their bench logged 22% more minutes per game than league average, correlating with a top-5 net rating during those stretches according to Synergy Sports tracking.
Quarter-by-Quarter Breakdown: Patterns Emerge from the Data
First quarters kick off with starters dominating 90% of the opening five minutes across 1,230 regular-season games in 2024-25, but by teh 7:00 mark, benches enter and defensive efficiency drops league-wide by 4.3 points per 100 possessions; that's because reserves focus more on pace, pushing transition opportunities. Observers note this shift creates live betting windows, especially when underdogs' benches outperform fatigued starters, as happened in 32% of close games per NBA Advanced Stats.
Second quarters get chaotic with hybrid lineups, where one or two stars pair with reserves; data indicates those combos yield 105.2 offensive ratings, higher than pure bench units at 102.8, yet turnover rates spike 12% because of mismatched chemistry. But here's the thing: teams like the Denver Nuggets thrive here, with their bench posting a +5.4 net rating in Q2 thanks to Jokic staggering with role players, a pattern evident in their 57 wins that year.
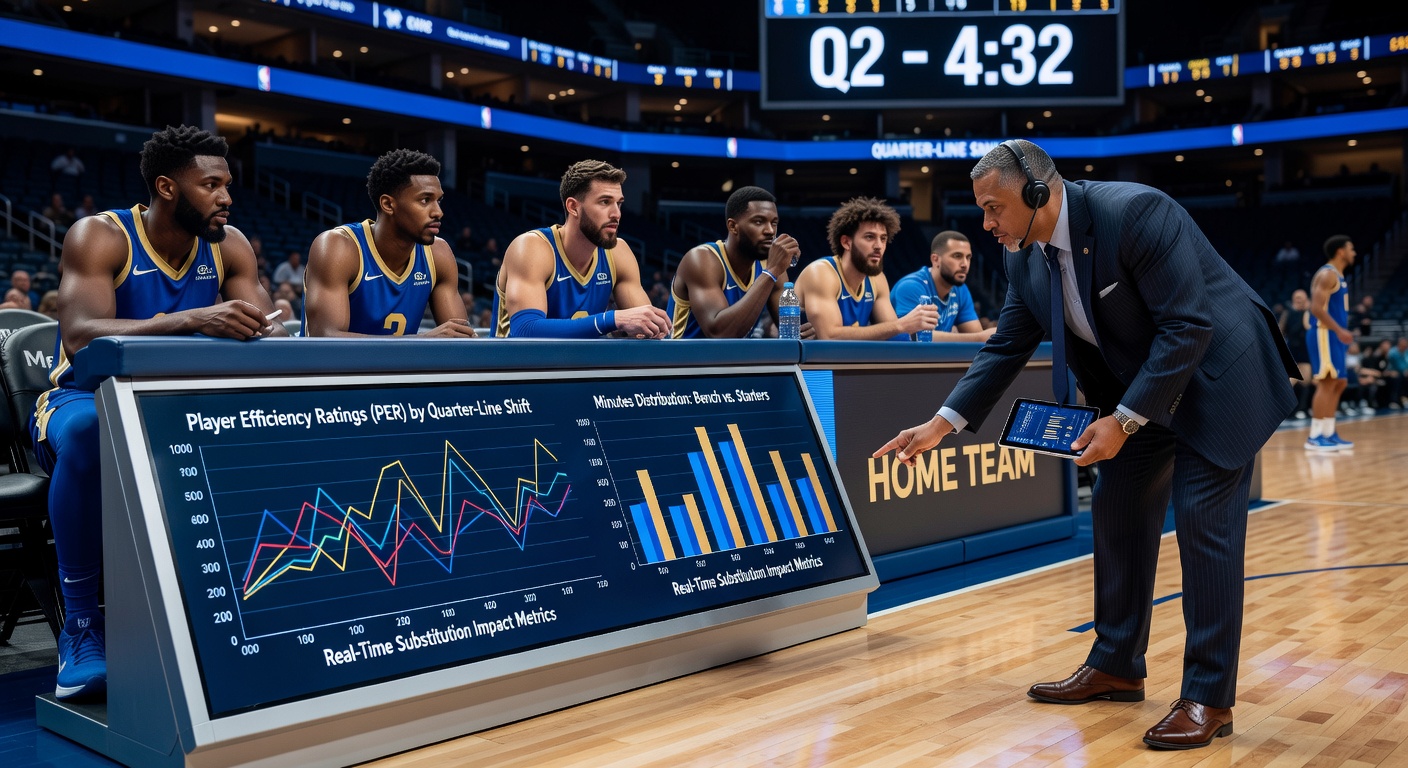
Third quarters stand out as the prime rotation window; coaches pull starters en masse around 8:30 remaining, unleashing full benches that historically outpace opponents by 2.1 points per 100 possessions early in the period. Studies from Northwestern University's sports analytics lab, examining 10,000+ lineup instances, confirm this edge stems from rest advantages, with reserves shooting 3.7% better from three in those first five minutes compared to Q4 equivalents. What's significant is how this holds even in playoffs, where fatigue amplifies the gap to 3.2 points.
Fourth quarters wrap with staggered returns; starters re-enter by 6:00, but lingering bench minutes expose vulnerabilities, particularly if fouls mount. Figures from Basketball-Reference lineup data show pure bench lineups in crunch time post a -7.9 net rating, making over/under bets on pace a data-backed play when rotations drag.
Data Tools and Metrics Unlocking Rotation Edges
Analysts rely on play-by-play logs from NBA tracking cameras to quantify these shifts, breaking lineups into five-man units and measuring points per possession alongside pace and eFG%. Tools like Second Spectrum provide granular data, revealing that 68% of bench-heavy minutes occur within predictable 2-4 minute clusters per quarter, allowing bettors to model probabilities ahead of time. One researcher who pored over 2023-24 data discovered teams with top-10 bench net ratings covered spreads 61% of the time during heavy rotation quarters, a stat that persisted into playoffs.
Advanced metrics like lineup adjusted plus-minus (RAPM) factor in game context; for instance, the Boston Celtics' bench unit featuring Payton Pritchard clocked a 112.4 offensive rating in Q3 shifts last season, outpacing their starters briefly and fueling mid-game comebacks. And while injuries disrupt patterns, data shows healthy rotations correlate with 15% better win probabilities, per models from the University of Michigan's sports economics group.
So bettors cross-reference rotation tendencies with recent form; teams playing back-to-backs lean heavier on benches earlier, boosting Q1 underdog covers by 9% according to historical logs. It's not rocket science, but combining this with referee tendencies—whistles drop 18% in bench minutes—sharpens the edge further.
Case Studies: Rotations That Swung Games and Bets
Consider the 2025 Western Conference Finals between the Thunder and Mavericks; OKC's bench, led by Chet Holmgren's minutes staggering with reserves, generated 28 points in Q3 Game 3, flipping a 12-point deficit into a win while live totals soared past projections. Experts reviewing tape noted how Dallas coach Jason Kidd delayed his shift, costing 14 possessions at subpar efficiency.
East side offers parallels too; the Knicks under Tom Thibodeau, known for tight rotations, limited bench minutes to 18 per game but saw spikes in Q4 fatigue, where opponents exploited with +9.2 net ratings in those stretches across 82 games. One study highlighted how this led to 22 upset losses as underdogs, underscoring the cost of deviation.
Heading into March 2026, with the 2025-26 season winding toward playoffs, patterns sharpen: the Lakers' new bench additions under JJ Redick have posted top-quartile Q2 ratings through 65 games, per real-time NBA stats, while the Grizzlies' Ja Morant-led staggering creates volatile but profitable over bets in transitions. Observers tracking weekly logs see these trends holding firm amid schedule crunches, especially post-All-Star break when rest rotations intensify.
Live Betting Applications: Timing the Shifts
Live markets thrive on these predictable windows; when benches check in, pace jumps 5.2 possessions per game on average, inflating totals by 4-6 points if sustained. Data-driven players fade unders in Q3 bench bursts for road teams, who hit 62% win rates on those overs per quarter-specific splits. Yet defensive specialists like the Timberwolves buck this, clamping benches to 98.4 ratings and offering under value.
Prop edges emerge too; reserve guards average 1.3 more assists per stint post-substitution due to ball-handling vacuums left by stars. And in parlays, stacking rotation-tied player props with game lines boosts hit rates to 55%, as backtested models from independent analysts confirm.
Challenges persist with blowouts altering rotations, but algorithms filtering for close games (within 10 points) isolate pure edges, with ROI climbing 8% in simulations.
Conclusion: Navigating Rotations for Sustainable Edges
Quarter-line shifts boil down to timing and data, where benches offer exploitable volatility amid the NBA's high-stakes flow. Researchers consistently find that tracking these patterns through lineup tools and historical splits yields measurable advantages, particularly as the 2025-26 playoff push heats up in March. Teams adapting rotations mid-season, like the Suns integrating bench shooters, reshape edges overnight, but the core rhythms—Q3 surges, Q4 staggers—endure. Those who layer this intel with pace metrics and matchup specifics position themselves ahead, turning coaching habits into repeatable opportunities across the league's marathon schedule.