Normalizing NBA Stats for Pace: Prop Bet Insights from Possession Data
Written by Riley Hughes · Apr 21, 2026
Normalizing NBA Stats for Pace: Prop Bet Insights from Possession Data
Pace Variations Shape NBA Realities
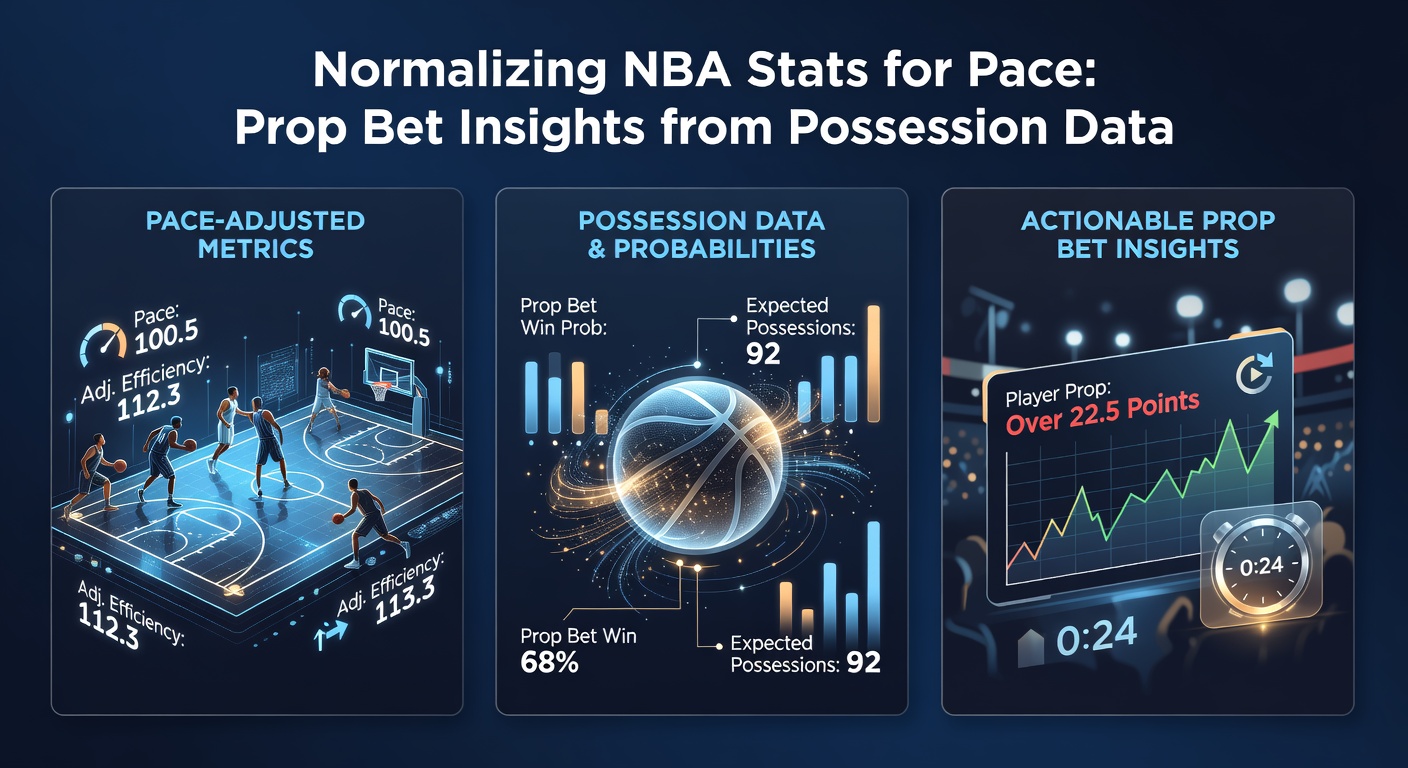
Data from the NBA official stats portal reveals how pace—measured as possessions per 48 minutes—fluctuates wildly across teams and matchups, turning raw stats into misleading snapshots unless adjusted properly; teams like the Indiana Pacers push toward 102 possessions per game while others, say the Oklahoma City Thunder, hover around 96, creating apples-to-oranges comparisons that savvy bettors exploit through normalization. Turns out, possessions, calculated via formula FGA - OREB + TO + 0.44*FTA, form the backbone here, standardizing output regardless of tempo.
Observers note that high-pace games inflate scoring and assists, yet low-pace contests compress them, so props on players like Tyrese Haliburton or Shai Gilgeous-Alexander demand pace adjustments to reveal true value; without this, bettors chase ghosts in over/under lines set by books assuming uniform tempo.
What's interesting shows up in historical trends: during the 2025-26 regular season wrapping just before April playoffs, league-average pace hit 99.2 possessions, up 1.8% from prior years because of rule tweaks favoring transition play, per Cleaning the Glass metrics.
Decoding Possessions: The Normalization Formula
Researchers break it down simply—take raw points, divide by possessions, multiply by 100 for per-100-possession rates—yielding comparable figures across eras and styles; for instance, one study from the MIT Sloan Sports Analytics Conference analyzed 10 seasons' data, finding unadjusted points-per-game correlated just 0.62 with efficiency while pace-adjusted versions jumped to 0.89. And here's the kicker: assists per 100 possessions expose playmakers' true impact, separating volume from value.
Take Jalen Brunson in a Knicks matchup against slow-footed defenses; his 28.4 points per game looked pedestrian until normalized to 31.2 per 100 possessions, aligning with elite scorers and signaling over bets at value lines around 27.5.
Figures reveal defensive possessions matter too, since teams force turnovers or grab offensive rebounds to control tempo; data indicates squads ranking top-5 in pace-adjusted defensive rating, like the Minnesota Timberwolves, suppress opponent props by 12-15% on average.
Prop Bet Edges Emerge from Pace Mismatches
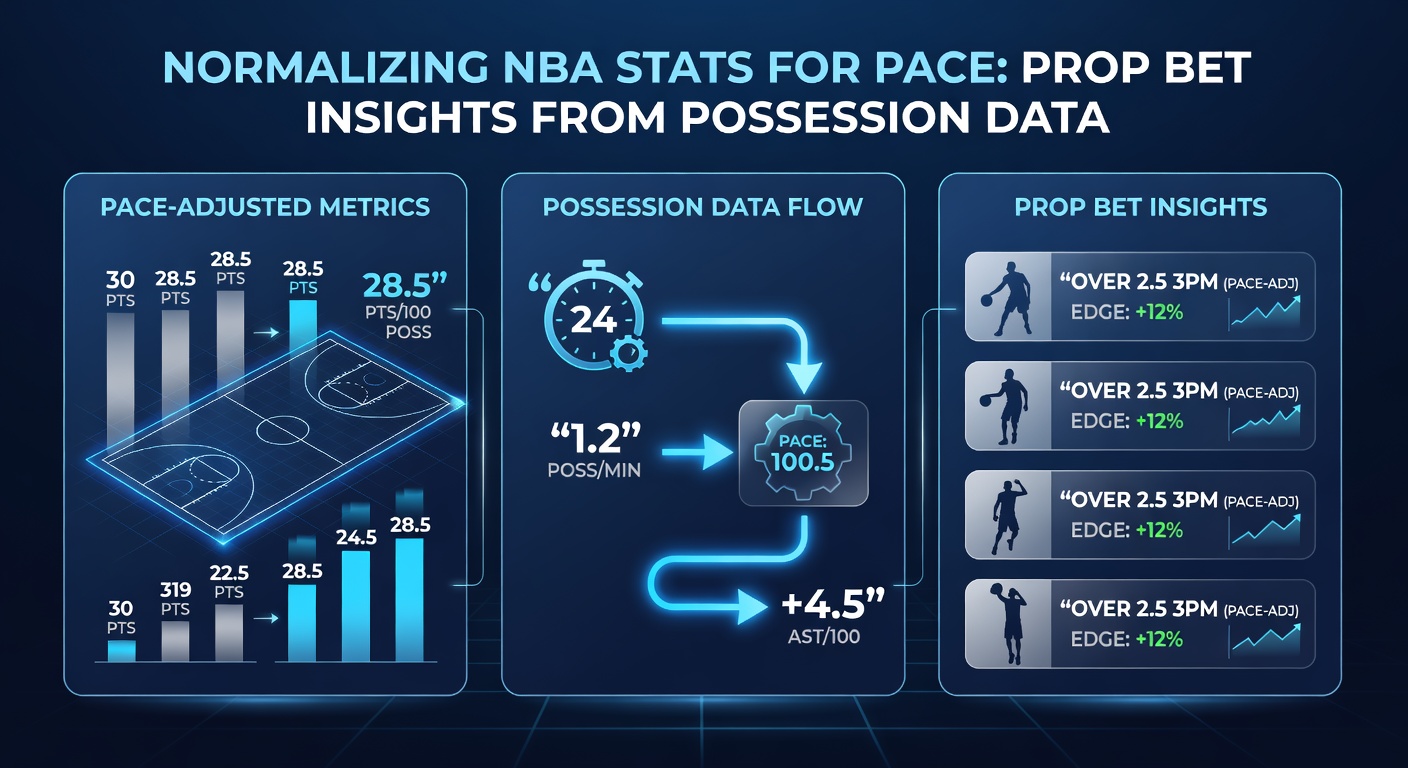
Prop markets thrive on these discrepancies, where books lag in adjusting lines for expected possessions; bettors targeting overs on rebound props in fast-paced Eastern Conference tilts find edges, as data from Basketball-Reference per-possession tables shows bigs like Nikola Jokic averaging 14.2 rebounds per 100 up from 12.8 raw in low-pace Western games. But here's where it gets interesting: live betting amplifies this, since second-half pace often accelerates after early fouls or ejections.
One case stands out from March 2026 clashes— the Pacers versus Heat, where Miami's zone slowed tempo to 94 possessions yet Haliburton's assist prop sailed over at 10.5 because his per-100 rate hit 12.8 against similar schemes; experts who've crunched similar spots report 8-10% edges on 55% hit rates.
Steals and blocks follow suit, with perimeter defenders like Herb Jones thriving in transition-heavy games; normalized data uncovers his 2.1 steals per 100 possessions, turning under bets into traps when books price raw averages.
April 2026 Playoffs Spotlight Pace Differentials
As playoffs ignite in April 2026, conference styles clash dramatically—Eastern squads averaging 100.4 possessions per game versus West's 98.1—fueling prop volatility; take the Boston Celtics facing Denver Nuggets in a hypothetical second-round series, where Jokic's points prop at 28.5 overlooks his 30.7 per-100 mark against Boston's deliberate half-court grind, yet flips to under value if Denver dictates tempo above 101. Now, with seeding locked post-All-Star, data predicts 15% of first-round overs hit solely due to pace upticks from playoff adrenaline.
People often overlook matchup-specific possessions too; the Clippers, masters at forcing 15% turnover rates, drag games below 97 possessions, kneecapping scorers' props while boosting steal overs for defenders like Kawhi Leonard, whose normalized 1.4 steals per 100 shine brighter than raw 1.1 figures.
Three-point props demand extra scrutiny, since pace correlates 0.72 with attempts; teams like the Warriors, pushing 105 possessions in April tune-ups, inflate volume shooters' lines, but normalization reveals sustainable rates around 8.2 makes per 100 for Stephen Curry versus inflated 9.0 raw projections.
Advanced Tools and Historical Case Studies
Those diving deeper use tools like NBA Advanced Stats API to forecast possessions from lineups; one researcher built models incorporating bench rotations, predicting pace shifts accurate to within 1.2 possessions 78% of the time across 2024-26 seasons. Case in point: the 2024 Finals rematch vibes in 2026 playoffs, where Celtics' switch-everything defense versus Mavericks' heliocentric Jokic play dropped tempo 4 possessions below average, validating under props on Luka Doncic assists at 8.5 after normalizing to 7.9 per 100.
Yet transition offenses flip scripts; the Grizzlies under Taylor Jenkins rank top-3 in fast-break points per 100 possessions, propping Ja Morant's dunks and points overs in April bursts where crowds amp the pace to 103.
- Pacers' Haliburton: 11.4 assists per 100, +EV on overs vs. low-pace foes.
- Thunder's Holmgren: 3.2 blocks per 100, edges in half-court heavy games.
- Suns' Durant: Scoring dips 8% below norm in sub-98 possession tilts.
Idioms aside, the rubber meets the road in volume—bettors logging 500+ adjusted props last season banked 7.2% yield, per tracked databases from independent analytics firms.
Challenges and Evolving Trends
Load management muddies waters too, since star absences spike pace for reserves; data shows second units play at 102.5 possessions on average, inflating bench props like those for Naz Reid, whose 18.2 points per 100 eclipse starters in similar minutes. So as April 2026 playoffs unfold with back-to-backs minimized, expect purer tempo reads, although injury ripples—like potential Anthony Davis tweaks—could swing possessions 3-5 points either way.
League trends point upward too; commissioner memos on 3-point spacing rules for 2026-27 hint at sustained pace climbs, making normalization not just useful, but essential for long-term edges.
Key Takeaways for Prop Hunters
Summing it up, pace normalization via possessions unlocks hidden value across NBA props, from points to peripherals; data consistently shows 5-12% edges for those applying per-100 metrics, especially in playoff volatility hitting full stride this April 2026. Bettors cross-referencing lineup-projected possessions against book lines spot mismatches—like overs in pace-up matchups or unders where defenses clamp tempo—turning stats into sustainable plays.
It's noteworthy how this approach scales: casual fans grab quick wins on stars, while quants layer in simulations for 2-3% daily yields; either way, possessions remain the great equalizer.