Packed Calendars Signal Fatigue Risks That Reshape Accumulator Strategies
Written by Otto Wagner · Jul 28, 2026
Packed Calendars Signal Fatigue Risks That Reshape Accumulator Strategies
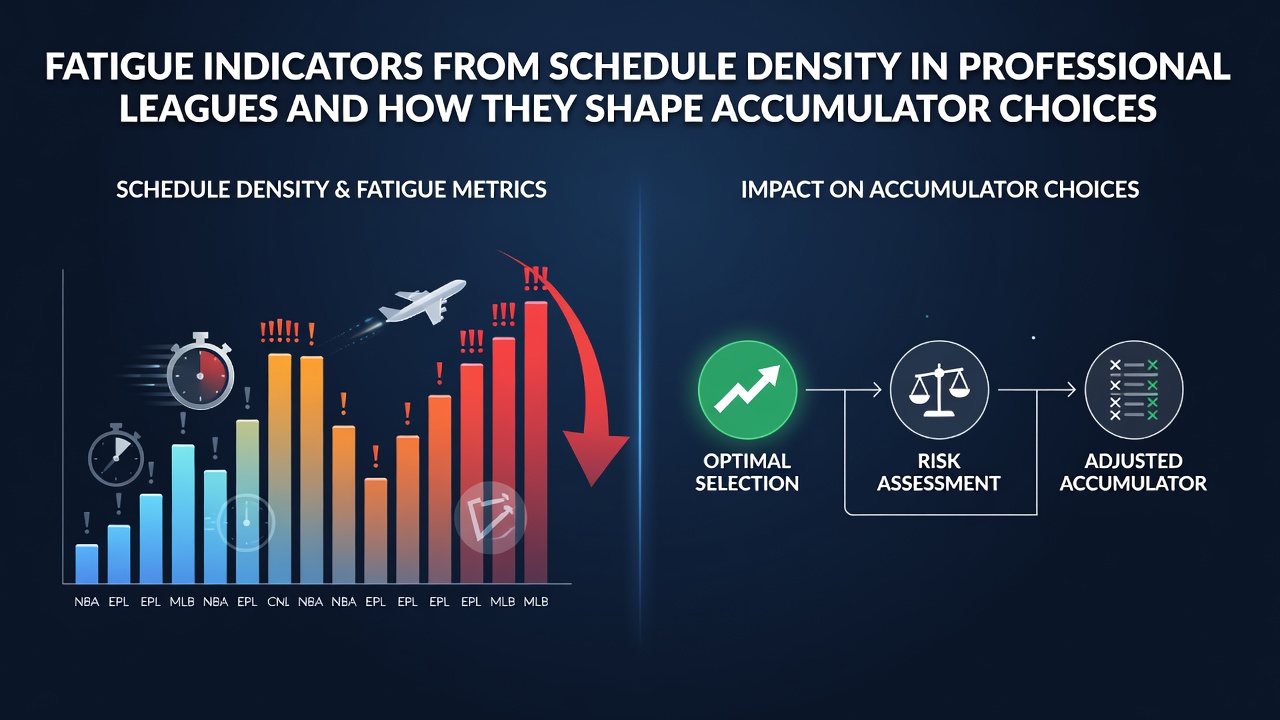
Professional leagues worldwide maintain increasingly dense schedules that compress recovery periods between matches, and researchers track these patterns through metrics such as consecutive games played, travel distance, and rest days. Data from the 2025-2026 NBA season showed teams averaging 2.8 back-to-back sets per month, while European football clubs navigated midweek Champions League fixtures alongside domestic leagues that left fewer than 72 hours between some contests.
Measuring Schedule Density Across Leagues
Schedule density refers to the concentration of competitive events within short timeframes, and analysts quantify it through variables including total games per week, cumulative travel miles, and overlap with international windows. In Major League Baseball, the 2026 All-Star break created compressed stretches where teams played 18 games in 20 days during July, according to league scheduling reports. National Hockey League teams faced similar clusters during the 2025-2026 regular season, with some clubs logging five games in seven nights during the holiday period.
These patterns produce measurable physiological stress, and studies from the Australian Institute of Sport have linked consecutive high-intensity matches to elevated markers of muscle damage and reduced sprint output. Observers note that leagues in North America and Europe publish fixture lists months in advance, allowing statistical models to forecast fatigue accumulation before betting markets fully adjust.
Key Fatigue Indicators Derived From Density Data
Performance databases record several indicators that correlate with schedule strain, and these include average minutes played per player across recent fixtures, total distance traveled in the prior 14 days, and the number of nights spent away from home facilities. NBA tracking systems documented a 12 percent drop in fourth-quarter three-point accuracy for teams playing their third game in four nights during the 2025 season. Soccer analytics platforms record similar declines in high-intensity runs after clubs complete three matches inside eight days.
Researchers at the University of Waterloo examined NHL data from 2020 through 2025 and found that goalie save percentages fell by 0.018 on average following back-to-back road games. Those figures reveal consistent patterns across positions and sports, giving bettors concrete variables to incorporate into accumulator selections.
Translating Indicators Into Accumulator Construction
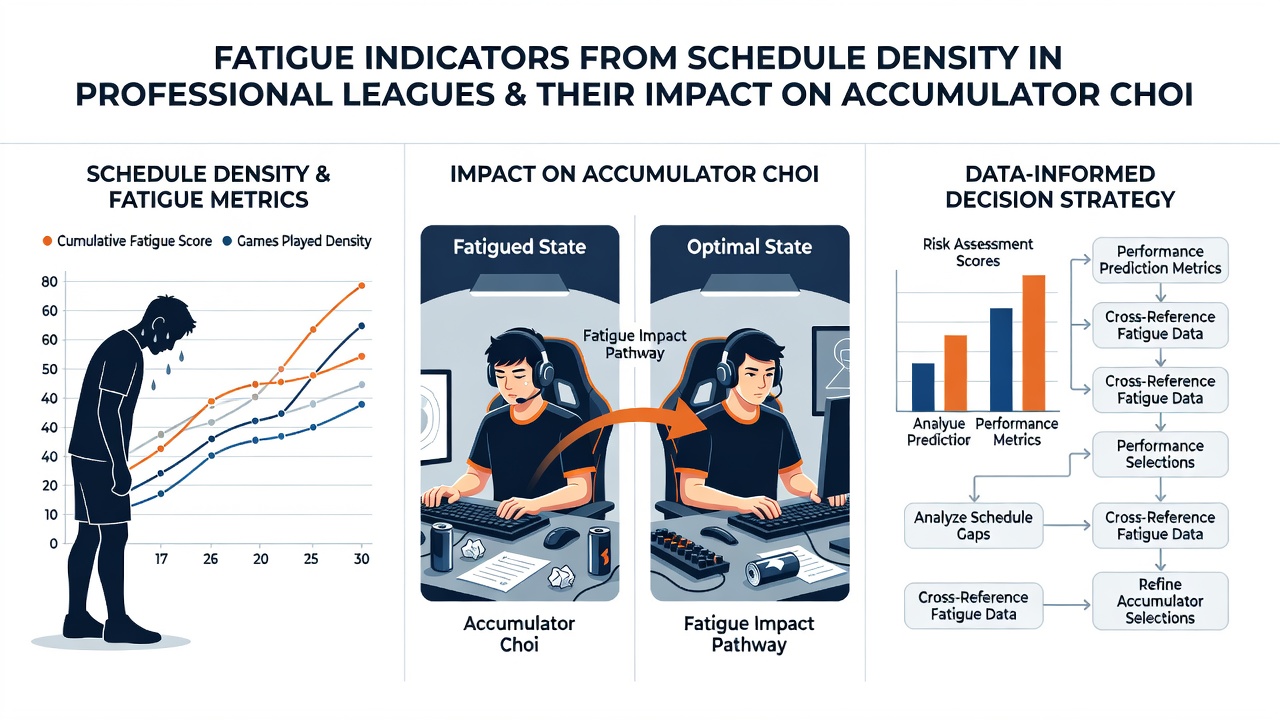
Accumulator bettors combine multiple selections into single wagers, and schedule-density data helps identify legs where fatigue effects may suppress scoring or increase error rates. One common approach involves targeting under totals when two clubs meet after both sides completed midweek travel, while another focuses on player props for athletes returning from minimal rest. European football markets during July 2026 pre-season tournaments already showed early examples where clubs with denser July schedules posted lower goal tallies in opening friendlies.
Betting operators release lines that reflect historical averages, yet models built on rest differentials can highlight discrepancies before lines move. Data from the Canadian Sport Institute indicates that basketball teams with fewer than 48 hours between games allow 4.2 more points per 100 possessions than those with extended recovery, providing a statistical edge when constructing multi-leg totals or player-performance accumulators.
League-Specific Patterns and Market Responses
Each sport displays distinct fatigue signatures that influence different bet types. In tennis, the ATP calendar places players on consecutive weeks of hard-court events during the North American summer swing, and point-win percentages for top seeds drop after three matches in five days according to official tour statistics. Horse racing meets in Australia schedule up to nine races per card across regional tracks, and jockey performance metrics show increased error rates on the final two races of dense programs.
Accumulator markets in these sports often combine game totals with individual prop bets, and density indicators help isolate selections where cumulative load produces measurable regression. Industry reports from the European Gaming and Betting Association note that operators have begun publishing rest-day statistics alongside standard form guides to meet demand for such data.
Conclusion
Schedule density generates quantifiable fatigue indicators that appear across professional leagues and directly inform accumulator construction through performance regressions tied to rest differentials and travel loads. Research institutions continue publishing updated datasets each season, while bettors integrate these variables into models that compare fixture congestion against historical outcomes. The result is a growing body of evidence that links calendar compression to specific statistical edges available before markets fully incorporate those effects.