Referee Bias Patterns in Basketball: Insights from Historical Foul Distributions
Written by Ellis Coleman · May 19, 2026
Referee Bias Patterns in Basketball: Insights from Historical Foul Distributions
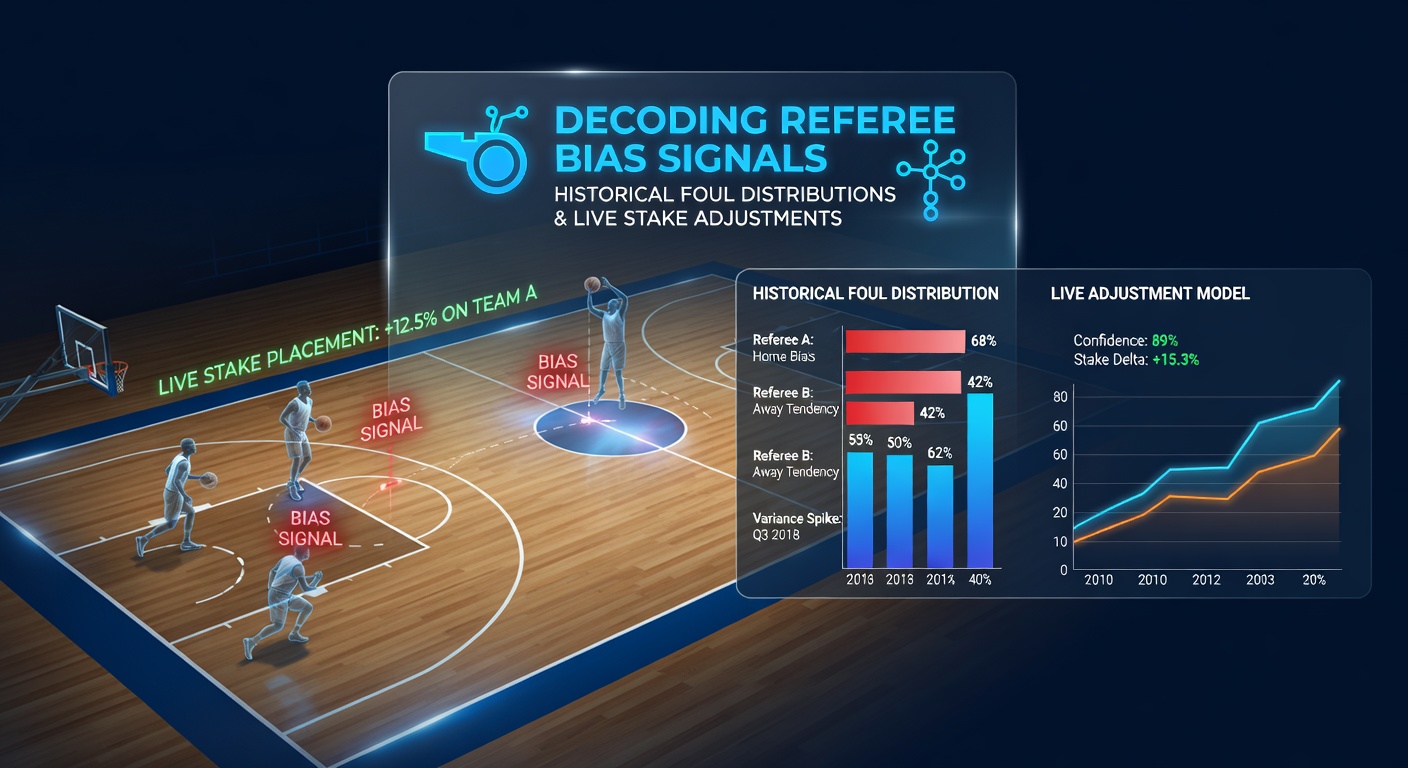
Professional basketball contests generate extensive foul data that observers can examine for recurring patterns tied to specific officials, and researchers have compiled these records from league archives to highlight systematic differences in call rates. Data from the past decade shows certain referees issue fouls at higher frequencies during road games while others maintain consistent totals regardless of venue, and analysts track these trends through possession-adjusted metrics that account for game pace and team style. Those who study referee assignments note that foul distributions often cluster around key variables such as player position, quarter of play, and score margin, which creates opportunities to interpret signals before live markets adjust.
Building Foul Histories for Individual Officials
League databases provide granular play-by-play logs that list every whistle along with the calling referee, and organizations maintain these files for seasons stretching back to the early 2000s. Analysts aggregate calls by official to produce per-game averages, then segment the numbers by home versus away status, by defensive scheme employed by each team, and by time remaining on the clock. Studies from the MIT Sloan Sports Analytics Conference have examined thousands of games and found that roughly one in five referees exhibits a measurable home-team leniency in the final minutes, while a smaller subset shows the opposite tendency when trailing teams attempt comebacks. These distributions emerge clearly once raw totals undergo normalization for minutes played and opponent foul-drawing reputation.
Teams publish advanced tracking data that includes foul locations on the court, and this spatial information adds another layer when combined with referee identities. Observers note that some officials cluster their calls near the basket while others spread whistles more evenly across the perimeter, and these spatial biases remain stable across multiple seasons. When historical files reach sufficient volume, statistical tests can isolate whether observed differences exceed random variation, which separates genuine referee tendencies from noise.
Identifying Live Signals During Active Contests
Once baseline distributions exist for each referee, real-time game feeds supply the inputs needed to compare current action against expected call volumes. Early-quarter foul counts that deviate from an official’s established average often foreshadow adjustments later in the contest, and bettors monitor these deviations through simple running tallies updated after every stoppage. Data indicates that referees who historically call more fouls in the third quarter tend to maintain that rhythm even when the score is close, whereas others tighten their criteria as the game tightens. Live stake placements can therefore shift toward over or under totals on total fouls once the first-half sample reveals which pattern is unfolding.
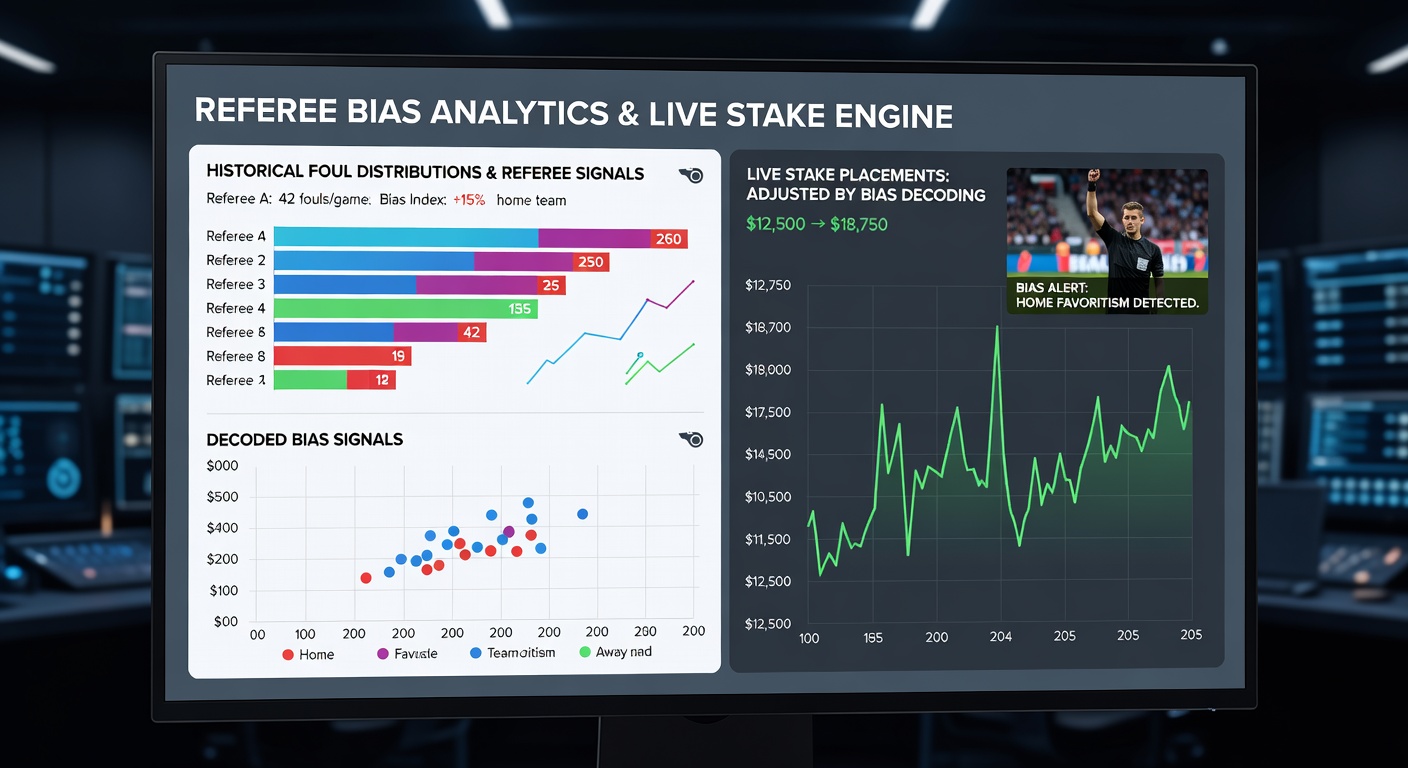
Player-specific tendencies also surface when historical records filter calls by matchup. Certain officials have documented higher rates of reaching fouls against star perimeter players, and these patterns strengthen when the same referee works consecutive games involving the same athlete. Live markets for player prop fouls therefore incorporate the referee’s prior interaction history as soon as the assignment becomes public, and adjustments occur rapidly once early minutes confirm whether the expected rate materializes. In May 2026, playoff series data continued to illustrate how these referee-specific filters alter projected foul lines by measurable margins before tip-off.
Adjusting Stake Sizes Based on Detected Deviations
Quantitative models convert observed deviations into recommended stake modifiers by comparing live foul pace against the referee’s career distribution. When current totals run 15 percent below the expected trajectory for a given official, models increase exposure on over-foul markets in later periods, and the size of the adjustment scales with the statistical significance of the gap. Conversely, early over-calling prompts reduced stakes or opposite-side positions once the historical baseline reasserts itself. These calculations rely on rolling windows that blend season-long data with the most recent 20 to 30 games to capture any short-term changes in referee behavior.
Bankroll allocation further incorporates the referee’s variance profile, because officials with wider historical distributions produce larger swings that require smaller position sizes to maintain consistent risk levels. Data from multiple European leagues demonstrates that referees with low call variance allow larger stakes when signals align, whereas high-variance officials warrant conservative sizing even when early counts match projections. This framework keeps overall exposure aligned with the reliability of the underlying signal rather than with raw deviation magnitude alone.
Practical Examples from Recent Seasons
One documented case involved a referee whose historical file showed elevated foul calls on post players during second halves of close games, and observers tracked an early second-quarter spike that matched the pattern in a 2025 playoff contest. Live positions on total fouls expanded accordingly, and subsequent calls followed the established distribution through the final period. Another instance highlighted an official with reduced whistle frequency when teams played at an above-average pace, and bettors noted the faster tempo in the opening minutes before scaling under-foul exposure for the remainder of regulation.
Cross-referencing multiple seasons reveals that these patterns persist across different team rosters and coaching staffs, which strengthens their predictive value when assignments repeat. Analysts update distributions after every completed game to incorporate new observations, and the process remains iterative because referee crews rotate frequently during condensed schedules. The result is a continuously refreshed reference set that supports stake recalibration throughout live betting windows.
Conclusion
Historical foul distributions supply measurable baselines that allow ongoing comparison against live game action, and the resulting signals inform adjustments to stake placement on total fouls and related props. Referee-specific tendencies in venue, timing, and player matchups remain stable enough for statistical detection once sufficient data volume accumulates, and models translate deviations into position sizing rules that reflect both magnitude and reliability. As tracking systems continue to expand, the precision of these comparisons improves, yet the core process continues to rest on systematic aggregation of past calls and real-time monitoring of departures from established norms.