Seasonal Scoring Rhythms: Mapping Efficiency Swings to Prop Line Adjustments in Gridiron and Court Sports
Written by Riley Hughes · Jun 11, 2026
Seasonal Scoring Rhythms: Mapping Efficiency Swings to Prop Line Adjustments in Gridiron and Court Sports
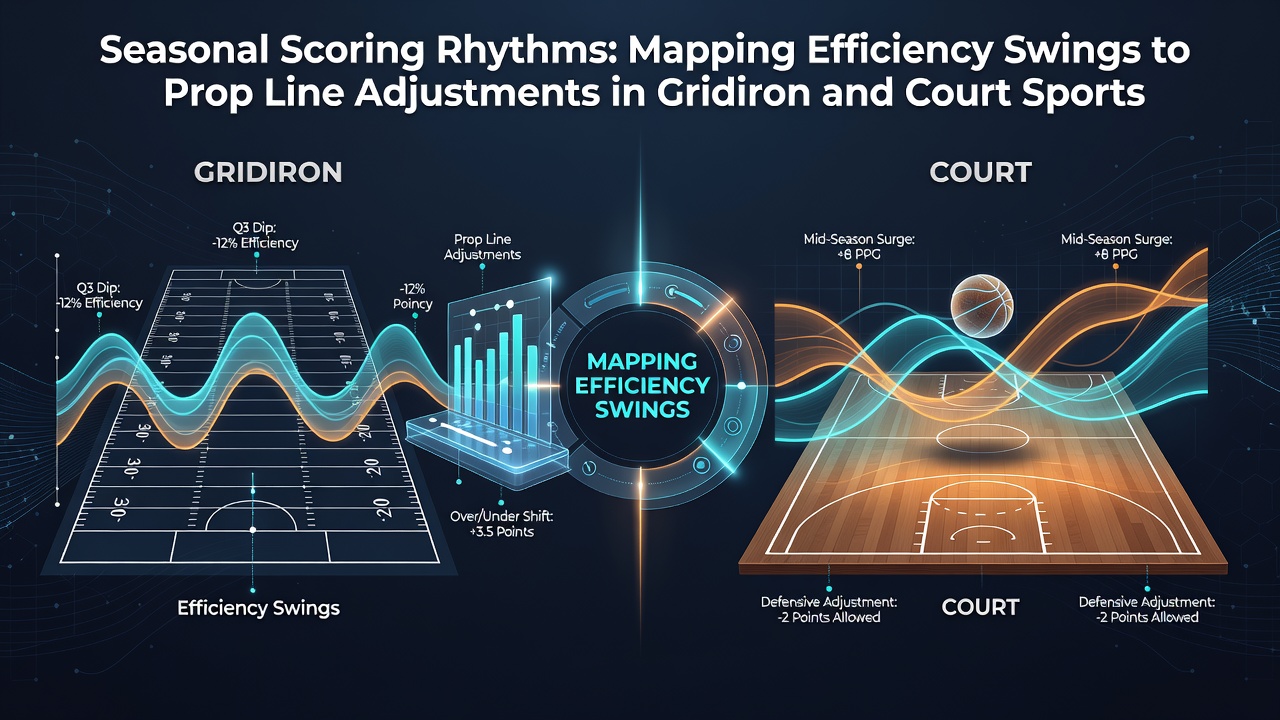
Gridiron and court sports both exhibit measurable shifts in team and player output as seasons progress from opening weeks through late stages, and analysts track these patterns to understand how prop lines respond. Data from league tracking systems show that rushing yards per attempt in the NFL typically decline by 8 to 12 percent after Week 10 in most seasons, while NBA teams experience a 4 to 7 percent drop in effective field goal percentage during the final third of the regular schedule. These efficiency movements create measurable impacts on player prop markets because oddsmakers incorporate historical trends and current performance metrics when setting lines each week.
Gridiron Patterns and Late-Season Adjustments
Researchers at the University of Michigan have documented that offensive line performance metrics, including pressure rates allowed, rise steadily from September through December because of accumulated injuries and weather variables. Running backs who post above-average yards after contact early in the year often see those numbers compress by mid-November, which leads sportsbooks to shade rushing props downward for affected players. Passing efficiency follows a different curve, with completion percentages holding steadier until the final four weeks when playoff positioning influences play-calling tendencies and teams reduce aggressive downfield attempts.
Prop line movement reflects these documented rhythms. When a quarterback's yards-per-attempt average falls below seasonal norms after Week 12, betting markets frequently adjust over/under totals by half a yard or more within a single week. Observers note that defensive efficiency also changes, with third-down conversion rates dropping league-wide in colder climates during December and January games. This creates opportunities for adjusted lines on both team totals and individual defensive player props such as tackles or sacks.
Court Sports and Monthly Scoring Fluctuations
Basketball analytics reveal parallel but distinct seasonal curves. Three-point shooting percentages for perimeter players tend to peak between December and February before declining through the playoff push, according to data compiled by the National Basketball Association's tracking partners. Bench rotation impacts compound these swings because coaches shorten rotations after the All-Star break, which alters minutes and usage rates for role players whose props appear regularly in daily markets.
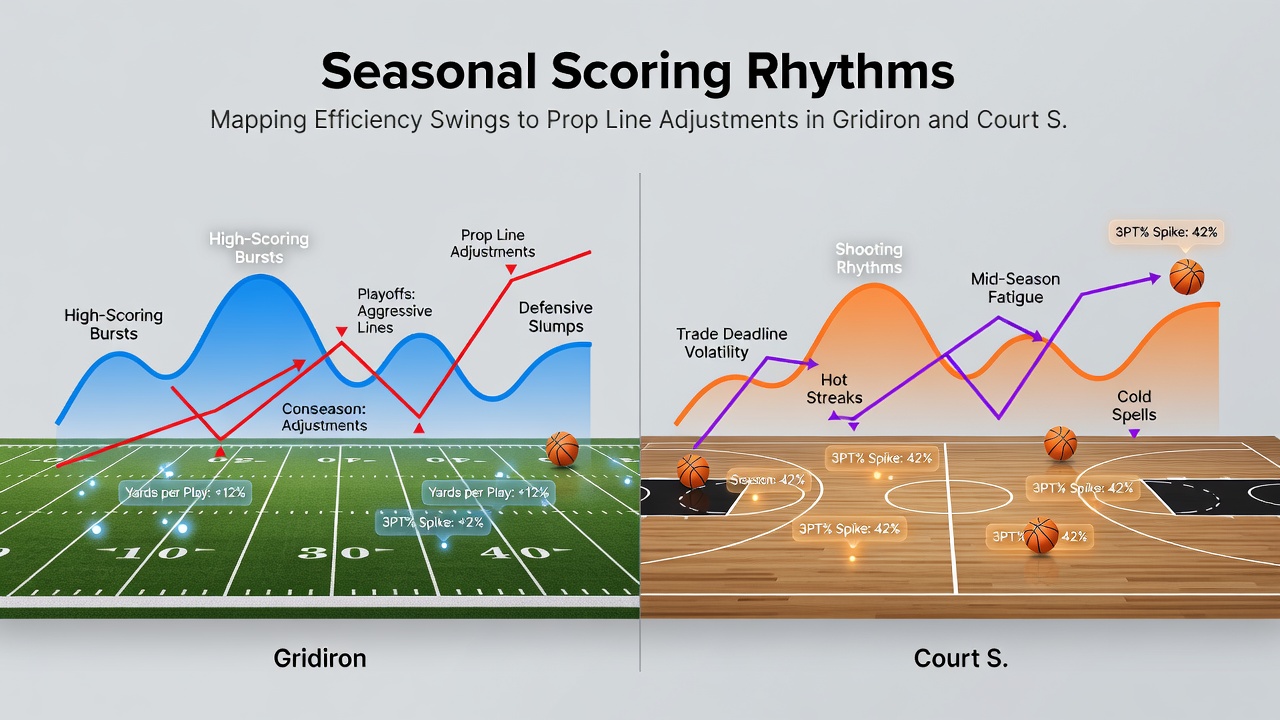
Point guard assist rates provide another clear example. Early-season figures often exceed late-season marks by 10 percent or more because teams experiment with lineups and increase transition opportunities before settling into half-court schemes. Sportsbooks respond by tightening or loosening assist props accordingly, especially for players whose usage spikes during injury-related absences. League-wide data from the 2025-2026 campaign showed average assist props moving downward by 0.8 assists per game between February and April across starting guards.
Connecting Efficiency Data to Market Responses
Oddsmakers integrate multiple data streams when recalibrating props. They combine play-by-play logs, injury reports, weather forecasts for outdoor venues, and travel schedules to project efficiency changes. In June 2026, several analytics platforms released updated models that weight late-season fatigue more heavily than earlier versions, which has already influenced how futures props for the upcoming NFL and NBA campaigns are being structured. These models demonstrate that teams with deeper benches maintain scoring efficiency longer, while squads relying on star-heavy rotations see steeper drops.
Prop adjustments occur incrementally rather than dramatically. A running back whose yards-per-carry average slips from 4.8 to 4.2 over eight weeks typically sees his rushing prop line reduced by 3 to 5 yards on average. Similar patterns appear in basketball, where a forward's points-per-game prop might drop by 1.5 to 2 points once defensive schemes adapt and minutes stabilize. Bettors who monitor these efficiency curves can identify when lines lag behind the underlying data trends.
Regional and Schedule Factors
Geographic considerations add another layer. Northern NFL teams encounter more pronounced efficiency declines in outdoor stadiums during December, while southern and dome teams maintain steadier output. In basketball, back-to-back game density increases after the trade deadline, which correlates with measurable dips in shooting efficiency for teams playing four games in five nights. International competitions such as FIBA windows further disrupt NBA player rhythms in certain months, producing short-term variance that oddsmakers must account for when setting props.
Studies from the Australian Institute of Sport have examined analogous fatigue patterns in other court sports and found comparable usage-rate declines late in seasons, supporting the broader principle that load management affects scoring outputs across multiple leagues. These cross-sport findings help analysts refine projections for both gridiron and basketball markets.
Conclusion
Seasonal efficiency rhythms in gridiron and court sports follow repeatable patterns that directly influence how prop lines are calibrated throughout each campaign. Tracking changes in rushing yards after contact, effective field goal percentages, assist rates, and related metrics allows market participants to anticipate adjustments before they appear. As data collection improves and modeling techniques evolve in 2026, the connection between measured performance swings and line movement continues to tighten, giving those who study these rhythms clearer signals for interpreting weekly prop offerings.